Number of Houses in Indonesia

BPS counting the number of houses according to their quality with the potential village census (Podes, 2008). Podes-2008 census is an activity that results will be used as the basis of 2010 Population Census. BPS quality house divided into 3 types of Permanent Houses, semipermanent and Not Permanent.

Permanent house are houses whose walls were made of the wall / wood (high quality), the floors made of tile / ceramic / high quality wood and its roof made of zinc / tiles / shingles / asbestos.

Semi-permanent house was the home whose walls a half wall / brick without plaster / wood (low quality), floor tile / cement / low-quality wood and corrugated iron roof / roof tile / shingle / asbestos.

The house is not permanent is the house whose walls are simple (bamboo / board / leaf), from the ground floor, and roof of leaves or a mixture of roof tile / zinc used and the like.
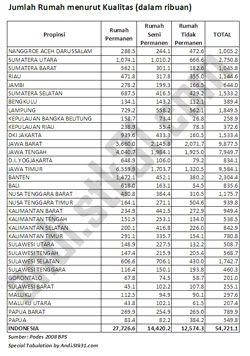
Based on calculations, in the year 2008 there were approximately 54.7 million houses in Indonesia (not including commercial, Rukan, beds, & other buildings rather than as a residence). The majority (50%) is the permanent house and about 23% houses are not permanent. Approximately 58.6% houses located on the island of Java, where Java, East Java, West and has the largest number of houses, close to 10 million house. As for Babel, Gorontalo, West Sulawesi, Maluku and North Maluku has a number of houses less than 300 thousand houses.

The number of these houses may be a measure of poverty in terms of housing, but the form of a houses in Indonesia is strongly influenced local culture and environment (forests, swamps, mountains and weather).

Child Health & Malnutrition

---------------------------------------------------------------------------------------------------
List of Indicators > Child Health & Malnutrition
---------------------------------------------------------------------------------------------------

Child Health

  • Percent of children (ages 0 to 4) with any form of immunization
  • Percent of children (ages 0 to 4) immunized against measles
  • Percent of children (ages 0 to 4) immunized - DPT
  • Percent of children (ages 0 to 4) immunized - Polio
  • Percent of children (ages 0 to 4) immunized - BCG
  • Percent of children (ages 0 to 4) fully immunized
  • Child (ages 0 to 4) monthly morbidity rate
  • Child (ages 0 to 4) average number of days lost due to illness
Child Malnutrition
  • Percent of children ages 0 to 4 breastfed
  • Average duration of breastfeeding without supplementary food - children ages 2 to 4
  • Average duration of breastfeeding with supplementary food - children ages 2 to 4
  • Average duration of total breastfeeding - children ages 2 to 4
Child Access to/Use of Medical Facilities/Personnel
  • Child (ages 0 to 4) visit rate to modern health faciltiies or personnel
  • Child (ages 0 to 4) contact rate to modern health faciltiies or personnel conditional on illness
  • Children (ages 0 to 4) doing self-medication

Prevalence/Control of Disease

---------------------------------------------------------------------------------------------------
List of Indicators > Prevalence/Control of Disease
---------------------------------------------------------------------------------------------------
  • Monthly morbidity rate
  • Average number of days lost due to illness
  • Visit rate to modern health faciltiies or personnel
  • Contact rate at modern health faciltiies or personnel conditional on illness
  • Percent of population doing self-medication
  • Percent of population with access to affordable essential drugs
  • Contact rate at traditional healer conditional on illness

School Attendance

-------------------------------------------------------------------------------------------------
List of Indicators > School Attendance
-------------------------------------------------------------------------------------------------
  • Gross enrollment rate - primary school
  • Male Gross enrollment rate - primary school
  • Female Gross enrollment rate - primary school
  • Gross enrollment rate - junior secondary school
  • Male Gross enrollment rate - junior secondary school
  • Female Gross enrollment rate - junior secondary school
  • Gross enrollment rate - senior secondary school
  • Male Gross enrollment rate - senior secondary school
  • Female Gross enrollment rate - senior secondary school
  • Gross enrollment rate - secondary school
  • Male Gross enrollment rate - secondary school
  • Female Gross enrollment rate - secondary school
  • Gross enrollment rate - tertiary level
  • Male Gross enrollment rate - tertiary level
  • Female Gross enrollment rate - tertiary level
  • Net enrollment rate - primary school
  • Male Net enrollment rate - primary school
  • Female Net enrollment rate - primary school
  • Net enrollment rate - junior secondary school
  • Male Net enrollment rate - junior secondary school
  • Female Net enrollment rate - junior secondary school
  • Net enrollment rate - senior secondary school
  • Male Net enrollment rate - senior secondary school
  • Female Net enrollment rate - senior secondary school
  • Net enrollment rate - secondary school
  • Male Net enrollment rate - secondary school
  • Female Net enrollment rate - secondary school
  • Net enrollment rate - tertiary level
  • Male Net enrollment rate - tertiary level
  • Female Net enrollment rate - tertiary level
  • Age-specific enrollment rate - primary school
  • Male Age-specific enrollment rate - primary school
  • Female Age-specific enrollment rate - primary school
  • Age-specific enrollment rate - junior secondary school
  • Male Age-specific enrollment rate - junior secondary school
  • Female Age-specific enrollment rate - junior secondary school
  • Age-specific enrollment rate - senior secondary school
  • Male Age-specific enrollment rate - senior secondary school
  • Female Age-specific enrollment rate - senior secondary school
  • Age-specific enrollment rate - secondary school
  • Male Age-specific enrollment rate - secondary school
  • Female Age-specific enrollment rate - secondary school
  • Age-specific enrollment rate - tertiary level
  • Male Age-specific enrollment rate - tertiary level
  • Female Age-specific enrollment rate - tertiary level
  • Ratio of girls to boys - primary school
  • Ratio of girls to boys - junior secondary school
  • Ratio of girls to boys - senior secondary school
  • Ratio of girls to boys - secondary school
  • Ratio of girls to boys - tertiary level

Educational Qualification

--------------------------------------------------------------------------------------------------
List of Indicators >
Educational Qualification
--------------------------------------------------------------------------------------------------

  • Mean years of schooling (ages 15 and over)
  • Male Mean years of schooling (ages 15 and over)
  • Female Mean years of schooling (ages 15 and over)
  • Mean years of schooling - prime working ages (ages 20 to 54)
  • Male Mean years of schooling - prime working ages (ages 20 to 54)
  • Female Mean years of schooling - prime working ages (ages 20 to 54)
  • Percent of population (ages 15 and over) with primary education or less
  • Male Percent of population (ages 15 and over) with primary education or less
  • Female Percent of population (ages 15 and over) with primary education or less
  • Percent of youth population (ages 15 to 24) with primary education or less
  • Male Percent of youth population (ages 15 to 24) with primary education or less
  • Female Percent of youth population (ages 15 to 24) with primary education or less
  • Percent of prime working age population (ages 20 to 54) with primary education or less
  • Male Percent of prime working age population (ages 20 to 54) with primary education or less
  • Female Percent of prime working age population (ages 20 to 54) with primary education or less
  • Percent of population (ages 15 and over) with senior secondary education or more
  • Male Percent of population (ages 15 and over) with senior secondary education or more
  • Female Percent of population (ages 15 and over) with senior secondary education or more
  • Percent of prime working age population (ages 15 to 24) with senior secondary education or more
  • Male Percent of prime working age population (ages 15 to 24) with senior secondary education or more
  • Female Percent of prime working age population (ages 15 to 24) with senior secondary education or more
  • Percent of prime working age population (ages 20 to 54) with senior secondary education or more
  • Male Percent of prime working age population (ages 20 to 54) with senior secondary education or more
  • Female Percent of prime working age population (ages 20 to 54) with senior secondary education or more

Adult Literacy

-------------------------------------------------------------------------------------------------
List of Indicators > Adult Literacy
-------------------------------------------------------------------------------------------------
  • Adult literacy rate (ages 15 and over)
  • Male Adult literacy rate (ages 15 and over)
  • Female Adult literacy rate (ages 15 and over)
  • Young adult literacy rate (ages 15 to 24)
  • Male Young adult literacy rate (ages 15 to 24)
  • Female Young adult literacy rate (ages 15 to 24)
  • Ratio of literate females to males (ages 15 and over)
  • Ratio of literate females to males (ages 15 to 24)
  • Adult language ability (ages 15 and over)
  • Male Adult language ability (ages 15 and over)
  • Female Adult language ability (ages 15 and over)
  • Adult literacy rate (ages 20 and over)
  • Male Adult literacy rate (ages 20 and over)
  • Female Adult literacy rate (ages 20 and over)
  • Adult language ability (ages 20 and over)
  • Male Adult language ability (ages 20 and over)
  • Female Adult language ability (ages 20 and over)

Housing Conditions & Access to Basic Services

-------------------------------------------------------------------------------------------------
List of Indicators > Housing Conditions & Access to Basic Services
-------------------------------------------------------------------------------------------------

Housing Conditions

  • Average floor area per capita
  • Percent of households with less than 10 sq. m. of floor area per capita
  • Percent of households living in own house
  • Percent of households with floor mainly of earth
  • Percent of households with floor mainly of earth or bamboo
  • Percent of households with walls mainly of bamboo
  • Percent of households with roof mainly of grass or leaves
  • Percent of households with roof mainly of wood, grass or leaves

Access to Basic Services
  • Percent of households with any source of electric lighting
  • Percent of households with PLN electric lighting
  • Percent of households with own drinking water facilities
  • Percent of households with pipe or pump source of drinking water
  • Percent of households with piped, pumped or protected well or spring source of drinking water
  • Percent of households buying drinking water
  • Percent of households with own sanitation facilities
  • Percent of households with toilet facilities
  • Percent of households with sewerage or septic tanks
  • Percent of Households with Save Drinking Water (Distance >10m from sawerage)

Expenditure Distribution and Inequality

List of Indicators > Expenditure Distribution and Inequality
  • Mean level of household expenditure (Rupiah)
  • Mean per-capita household expenditure (Rupiah)
  • Median per-capita household expenditure (Rupiah)
  • Mean per-capita household expenditure on food (Rupiah)
  • Mean per-capita household expenditure on non-food (Rupiah)
  • Gini ratio
  • Percent of total expenditure on food (Engel Coefficient)
  • Percent of total expenditure on education
  • Percent of total expenditure on health
  • Share of expenditure for the poorest expenditure quintile
  • Share of expenditure for the second expenditure quintile
  • Share of expenditure for the third expenditure quintile
  • Share of expenditure for the fourth expenditure quintile
  • Share of expenditure for the highest expenditure quintile
  • Expenditure ratio (ratio of first to fifth expenditure quintile)
  • Expenditure ratio (ratio of bottom two to fifth expenditure quintile)

Poverty

List of Indicators > Poverty
  • Number of population below the poverty line ('000)
  • Percent of population below the poverty line
  • Poverty gap index (P1)
  • Poverty severity (FGT) index (P2)
  • Number of households below the poverty line ('000)
  • Percent of households below the poverty line
  • Number of population below the poverty line raised by 25% ('000)
  • Percent of population below the poverty line raised by 25%
  • Poverty gap index (P1) - poverty line raised by 25%
  • Poverty severity (FGT) index (P2) - poverty line rasied by 25%
  • Number of households below the poverty line raised by 25% ('000)
  • Percent of households below the poverty line raised by 25%

List of Indicators

1. Poverty
2. Expenditure Distribution and Inequality
3. Housing Conditions & Access to Basic Services
4. Adult Literacy
5. Educational Qualification
6. School Attendance
7. Prevalence/Control of Disease
8. Child Health & Malnutrition
9. Fertility & Reproductive Health
10. Population & Household Composition
11. Labor Force Participation
12. Economic Infrastructure and Services
13. Social Infrastructure and Services
14. Participation on the Market (Sectoral)

Population Below Poverty Line by Districts

This table describes percentage of Indonesia population that expenditure percapita per month below poverty line. We use National Socioeconomics Survey from 1996 until 2007.

This pdf file can donwload free but you can not print, copy or convert to other format.
Please contact Andi (andidn@gmail.com) for excel format table.


Percentage of Indonesia Population below Poverty Lines by Districts 1996-2007 -